How to debug JavaScript code with Chrome developer tools

Debugging JavaScript code is an essential skill. Since you don’t compile JavaScript code, you won’t get any compilation errors. This means you often will find bugs during runtime. To be an effective front-end developer, you need to be able to track down and fix bugs fast.
In this post, I will show you different ways to debug code. This way you will know how to use the different alternatives, so you can be more efficient tracking down and fixing bugs.
Example code
To show you how the debugging tools work in practice, I have prepared some example code:
HTML:
<!DOCTYPE html>
<html>

<body>
    <h1>Debugging JavaScript</h1>
    <button onclick="onClick()">Click me</button>
    <script src="app.js"></script>
</body>

</html>
This is a very simple HTML page with a header, button and a link to a JavaScript file.
The JavaScript code in app.js looks like this:
function onClick() {
    x = 5;
    y = 6;
    calculate(x, y);
}

function calculate(x, y) {
    var result = x * y;
}
Here we got an onClick function which gets triggered when the user clicks on the button. This onClick function will call the calculate function.
Debugging in the browser
All the major browsers today like Chrome, Firefox, Edge, Safari have debugging features which will work quite well. However, Chrome is known for its excellent developer tools which are praised in the developer community.
I will, therefore, focus on Chrome in this post.
To start the developer tools you have to start Chrome and use the following shortcuts:
IOS: Cmd + Opt + I

Windows: Ctrl + Shift + I
This is how the developer tools window looks like:

We will focus on the following sections:
Console
This is where your errors or other logging messages outputs. Here we can also manipulate the data. We will cover that in more details later.
Sources
This is where all the files are on your website. Here we can examine the HTML files and set breakpoints to our JavaScript files.
Debugging using console.log()
This is how most developers are debugging their web apps. I use this a lot, but to be honest, it is not the optimal way to debug your code.
It is an easy way to log what your code does. The problem is that you mix debugging logic in your production code. It is easy to forget removing this code after you have fixed your bug, leaving a lot of debugging stuff inside your code.
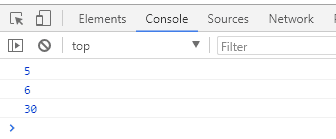
To update our example with console.log(), it might look like this:
function onClick() {
    x = 5;
    console.log(x);
    y = 6;
    console.log(y);
    calculate(x, y);
}

function calculate(x, y) {
    var result = x * y;
    console.log(result);
}
When we click the button on our web page, the console output will look like this:
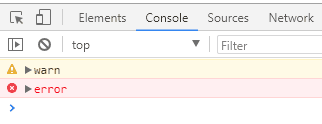
Warnings and errors using console.warn() and console.error()
There is also a warn and an error function to the console API. These are color coded in the developer tools console. This way you can easily see the difference between ordinary logging and error messages.
console.warn("warn");
console.error("error");
This will have the following output in Chrome’s console window:
Tables using console.table()
Console.Table() will show a nicely formatted table from arrays.
Example:
var people = [
    { firstName: 'Jane', lastName: 'Doe', age: 21 },
    { firstName: 'Jim', lastName: 'Smith', age: 35 },
    { firstName: 'Angus', lastName: 'Young', age: 63 },
    { firstName: 'Annie', lastName: 'Peterson', age: 56 }
];

console.table(people);
This will output the following in the console:

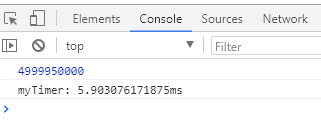
Measuring performance using console.time() and console.timeEnd()
You might be wondering how much time a piece of logic takes. A great way to do that is to use console.time() and console.timeEnd():
console.time("myTimer");
var sum = 0;
for (let i = 0; i < 100000; i++) {
    sum += i;
}
console.log(sum);
console.timeEnd("myTimer");
Here we start a timer and loops through the number 0 to 100000. We just add the current number to the sum. We run the timeEnd function in the end to stop the timer.
This will show the following in the console window:
Adding debugger; in your code
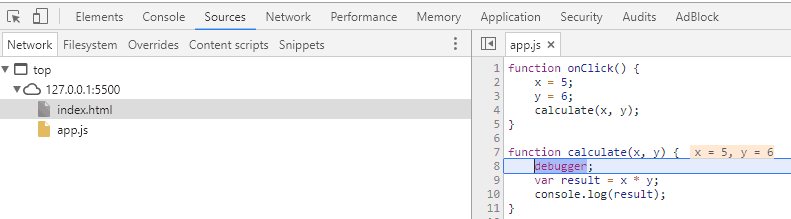
Consider the example code we had from the start:
function onClick() {
    x = 5;
    y = 6;
    calculate(x, y);
}

function calculate(x, y) {
    debugger;
    var result = x * y;
    console.log(result);
}
Notice we have added a debugger line in the calculate function. This will stop the program when it reaches that point. Remember, you have to have Chrome developer tools open to make this work.
Click the ‘Click me’ button and you should see something like this:
Using the debug() function
A similar way to stop the program in a given function is to use the debug() function. Here you just type in the Console window which function you want to stop the program.
First, remove the debugger; line from the example code.
Second, refresh the web page. In the console window, type debug(calculate) and hit enter.
Lastly, click the button and your program should stop here:

Setting breakpoints
This is the preferred way to debug your application. Unlike using methods from the console API, we won’t be messing up the production code with a lot of debugging code.
When setting a breakpoint in a JavaScript file in Chrome, the code will stop at the breakpoint (remember that the developer tools have to be open for this to happen).
Try it out by opening the developer tools. Click on “Sources” which is to the right of Console. Open the app.js file by clicking on it, and on the line right under the function calculate, click on the line number on the left.
Now you see there is a blue mark at the line number. This is the breakpoint. Now, click the button on the web page, and your developer tools should look like this:
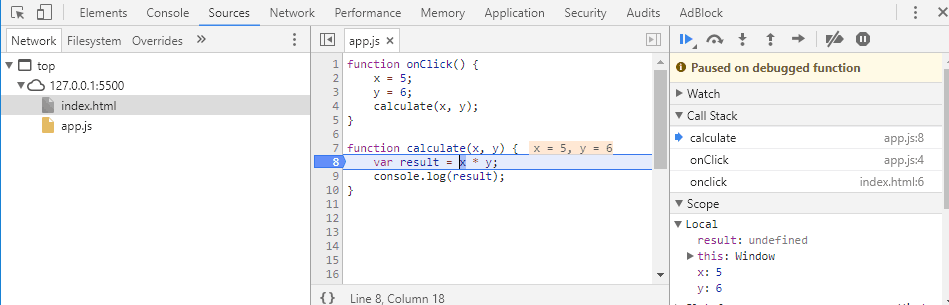
This is a very powerful tool, and there is a lot of info here. Let’s break it down.
We see here that line eight is highlighted. This is where the code has stopped. At the line above you can see the values of x and y. You can also see these values in the local scope at the bottom right. You can see that the variable result is undefined. That is because the line with the result variable hasn’t yet been executed.
The stepping options
At the top right, above the text “Paused on debugged function”, you can see some symbols. These are the different stepping options. I will go through the most important ones so you know how they work.
Resume script execution (F8): This just continue your code until you reach another breakpoint, or you have a debugger line in your code.
Step over next function call (F10): When you click this, you will step to the next line. So in the example above, you would go to line number 9. Then your result variable would get assigned the calculated value, and you would see that value in the editor at the bottom right.
Step into next function call (F11): In the example above, this would do the exact same as if you hit F10. However, if you had the breakpoint at line 4, this would step into the calculate function. So the current line would then be 8. But if you hit F10 on line 4. You would just go to line 5.
These are the main stepping options you will be using most of the time.
Call Stack
In the same image above, you can see this section at the right. This is a very useful feature when the code is deep within a function hierarchy.
The blue arrow next to the calculate text indicates that we are currently in the calculate function. The line under that says “onClick”. This means that calculate was called from the onClick function. The third line shows it was called from the onclick event on the index.html file.
In this simple example, it is very easy to see the function hierarchy. But imagine if you had a complex application. Then this would be very useful.
Bonus tip #1
If you are in the sources pane. You could have hundreds of javascript files, and it could be a hassle to find the file you are after. A useful shortcut is CTRL + O. Then you can search the files in your project.
Bonus tip #2
While you are in debug mode and you have reached a breakpoint, you have the possibility to change the variables. For instance, let us use the example from above, where the code has stopped at the breakpoint on line 8.
Here you can go back to the Console pane and type in the console window: “x = 10”. Then you can go back to Source pane and hit F10 to step one step further. Then you notice the x variable has changed to 10.
This is great for testing out different scenarios.
Conclusion
Debugging is an essential skill to master as a web developer. With Chrome developer tools you have a powerful, free debugger at your fingertips.
In this post, we have seen two ways of debugging. By adding debugger or using the console API in your code, and setting breakpoints in your source files.
Adding things like console.log() in your code are very fast and easy thing to do. It is not the best way since you are messing with your production code, and you get limited information.
Setting breakpoints in your code, however, are a much better way. Here we see all the accessible variables with their values, the entire call stack, and you have the ability to go through the code step by step.