
Image Recognition Tutorial in Python for Beginners

This tutorial focuses on Image recognition in Python Programming. The tutorial is designed for beginners who have little knowledge in machine learning or in image recognition.
Environment Setup
The tools that we are going to use in this tutorial are:
- Python 3
- Matplotlib
- Numpy
- scikit-learn/ sklearn
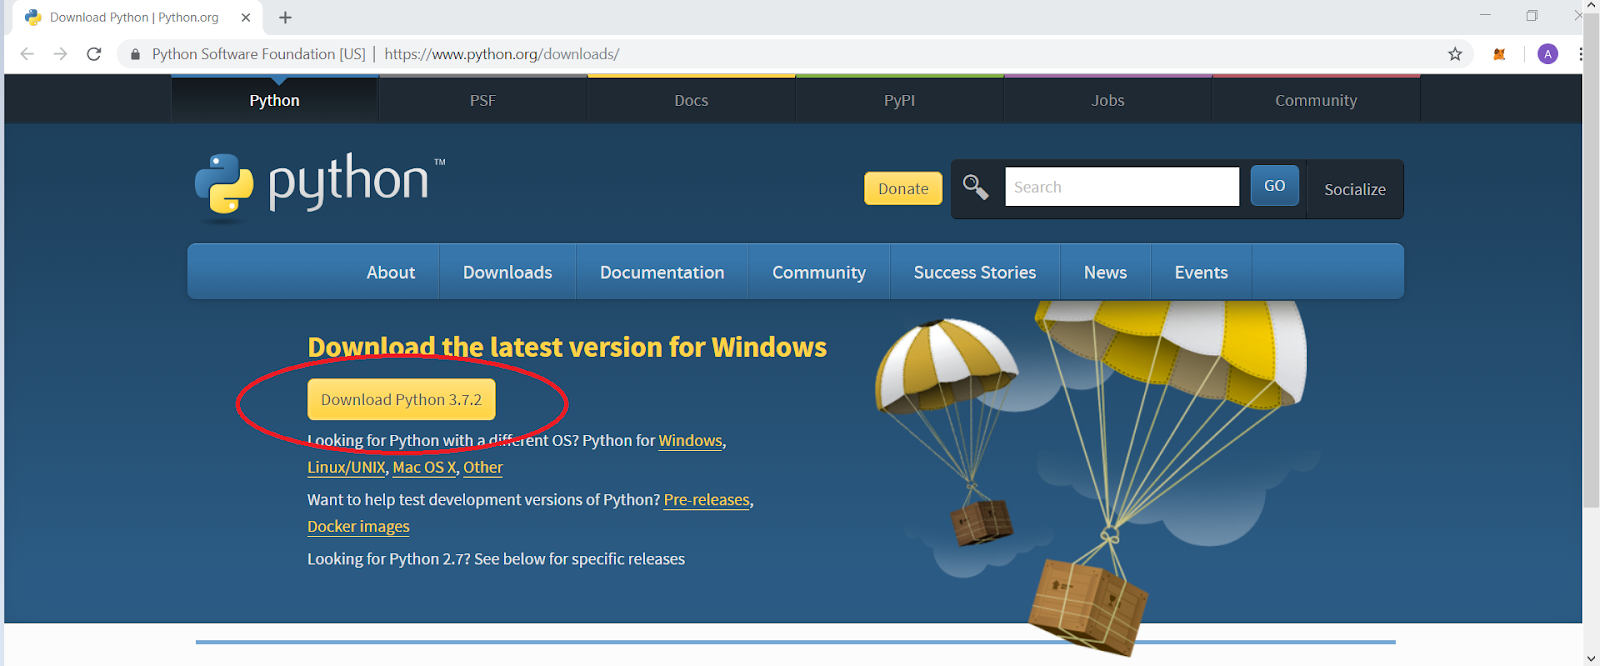
You can install Python from Download Python. Remember to add Python to environment variable.
When python is installed, pip is also installed and you can download any modules/ libraries using pip. The modules Matplotlib, numpy, and sklearn can be easily installed using the Python package Manager.
Run the following pip command in command prompt to check if we have pip installed or not:
pip --version
Now to install Matplotlib, you will write:
pip install matplotlib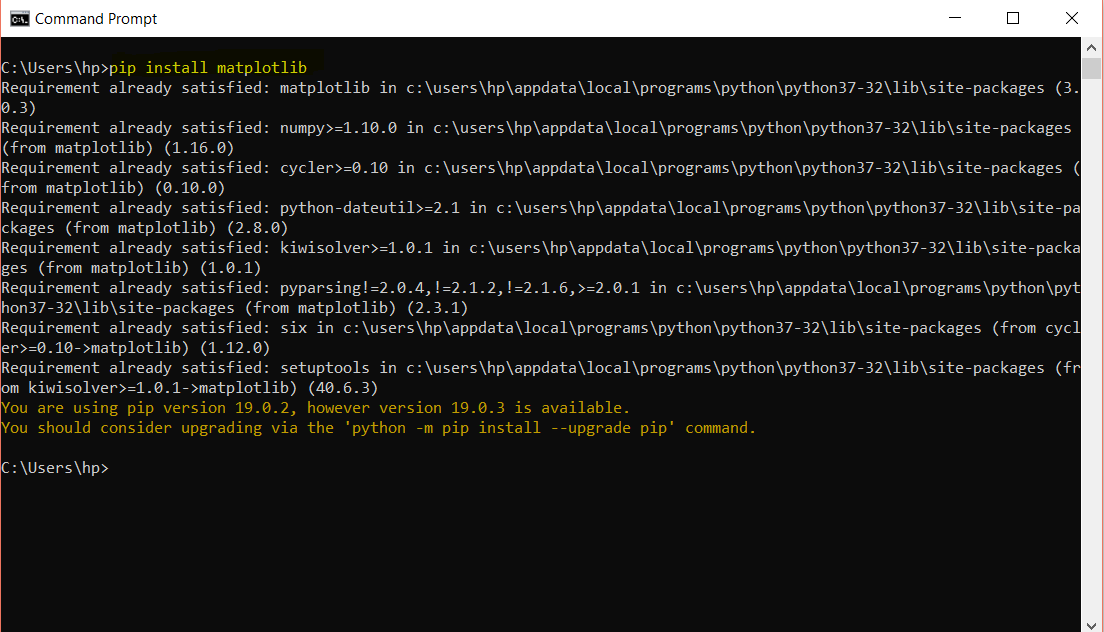
As I have already installed the module so it says requirement is satisfied. Similarly, run:
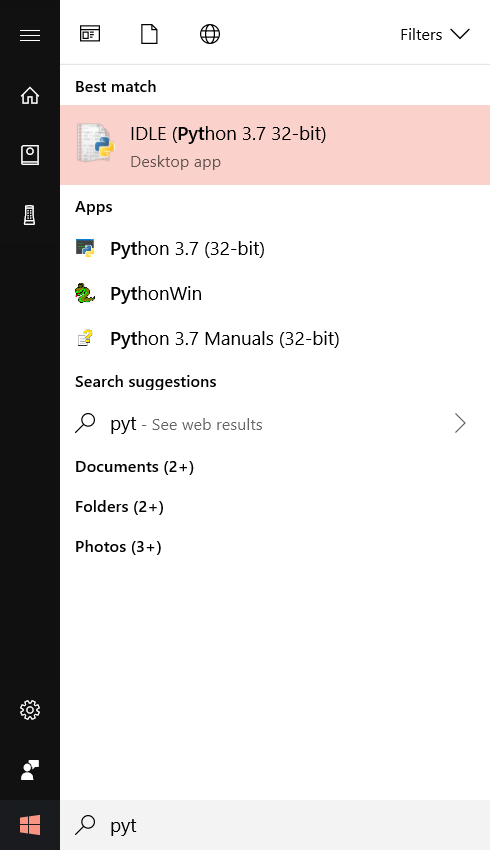
pip install numpyLet’s check if the modules that we installed are actually there or not. Open python shell from start menu and search python IDLE.
Hit the enter key and you will have the following window opened:

This is called the python shell where the python commands can be executed. To check, if the required modules are installed, import the modules in python shell using the import keyword as follows:
import numpy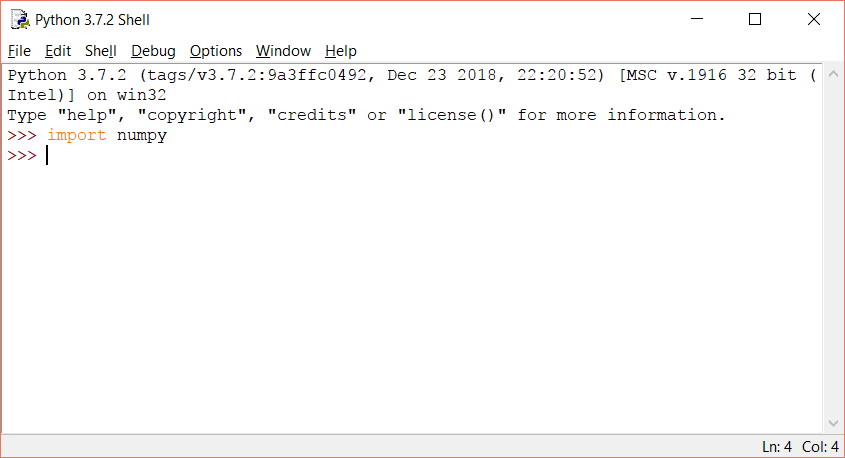
If the module is not installed, you will get an error. Similarly, import the other two modules:
import matplotlib
These are the very basic modules that we need for images. The numpy module is used for arrays, numbers, mathematics etc. We are using numpy to convert our images in to arrays as our machines understand arrays and numbers or to flatten our images using reshape. The image is actually a matrix which will be converted into array of numbers.
The matplotlib is used to plot the array of numbers (images). From this tutorial, we will start from recognizing the handwriting.
Python provides us an efficient library for machine learning named as scikit-learn. The scikit-learn or sklearn library comes with standard datasets for example digits that we will be using.
To install scikit-learn, run the following pip command:
pip install sklearn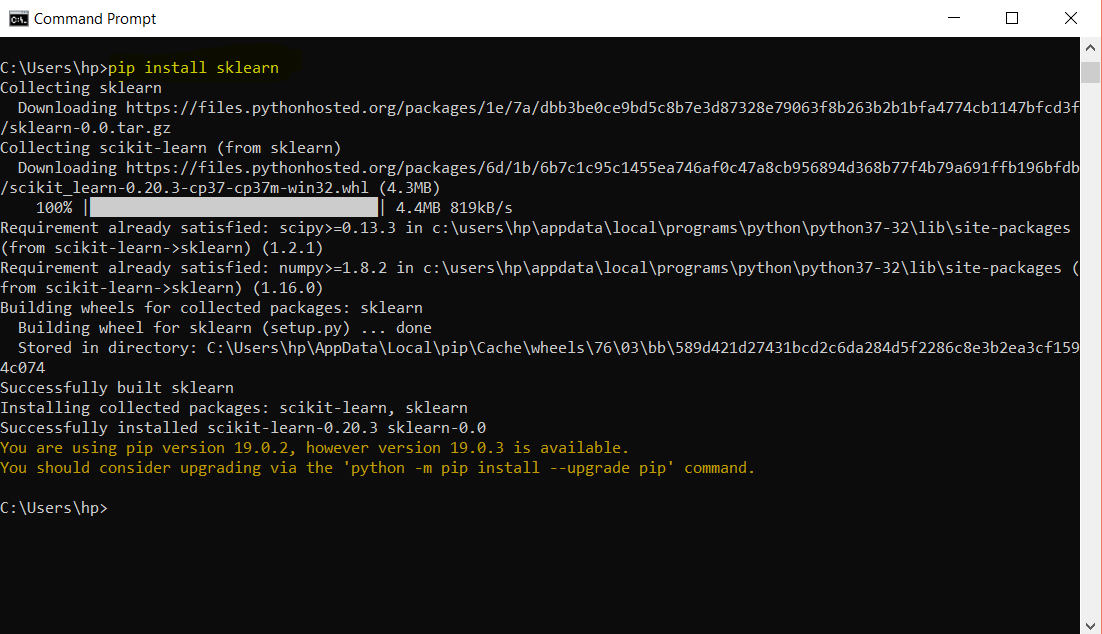
Okay, so we have everything to get started.
Recognizing Handwriting
The first step that is required to do is to load the dataset. First import the module:
>>> from sklearn.datasets import load_digits
Here we say, load the digits from the datasets provided by sklearn module!
Now read the dataset and store it in a variable:
>>> digits_data = load_digits()The load_digits() method will read the digits into the digits_data variable. If you want to check what is inside digits_data, type the following command:
>>> digits_data.data.shapeThe result will be:

This means that we have 1797 image samples with 64 different features. 1797 samples corresponds to 1797 target values but the target values have 10 unique values from 0 to 9. From this we can derive that all 1797 values are the different forms of range from 0 to 9 and we just have different samples of numbers from 0 to 9.
Okay, so we have our digits stored. Let’s check if we actually got them as image or not:
Import the matplotlib to plot the images as:
>>> import matplotlib.pyplot as pltUse the matshow() method which will display the image array as a matrix.
>>> plt.matshow(digits_data.images[0])So here we have selected the 1st image from our dataset whose index is 0. Now display this matrix using show() method of matplotlib:
>>> plt.show()
To convert this image into gray image use:
>>> plt.gray()>>> plt.matshow(digits_data.images[0])>>> plt.show()
For machine learning, all the images will be grayscale images represented as an array. Each element of the array represents a pixel of the array. The pixel values range from 0 to 255 where 0 stands for black and 255 represents a white pixel as shown below:
>>> digits_data.images[0]
In the next step, we will implement the machine learning algorithm on first 10 images of the dataset.
Consider the following steps:
Visualize the images with matplotlib:
The handwritten images are stored in the image attribute of the dataset and the target labels or the original numbers are stored in the target attribute of the dataset. Fetch the target labels and the handwritten images and store them as below:
>>> images = list(zip(digits_data.images, digits_data.target))The zip() function joins together the handwritten images and the target labels. The list() method creates a list of the concatenated images and labels. The result is stored in a variable.
To plot the images, define the size of the plot screen:
>>> plt.figure(figsize=(4,4)) 
Use the for loop to iterate through the first 10 images and plot them. As we have stored our images and target data into a list named images, we will use the enumerate method so that the handwritten images go into the image variable in for loop and the target labels go into the label variable in for loop. So for loop iterates through the handwritten images and through the target labels as well:
>>> for i, (image, label) in enumerate(images[:10]):
	#initializing subplot of 3x5
	plt.subplot(3,5, i+1)
	#display images in the subplots
	plt.imshow(image, cmap=plt.cm.gray_r, interpolation='nearest')
	#set title for each subplot
	plt.title("Training: %i" % label)
#display the plot
>>> plt.show()
The result will be:

If we read more than 10 images for instance 15, the result will be:

You can see here first we have samples from 0 to 9, then we have another different sample of 0 to 9 (of different handwriting).
Okay, now we have the most import part where machine learning is being performed:
Machine learning
The first step is to define and declare the variables for the handwritten images, the target labels and the total number of samples. You can use the following code:
#get the total number of samples
>>> img_samples = len(digits_data.images)
This would define the number of images on which we have to perform our machine learning algorithm
#get the handwritten images
>>> img = digits_data.images.reshape(img_samples, -1)
We have used the reshape method to reshape the images to flatten the images so that machine learning algorithm can be performed.
#get the target labels
>>> labels = digits_data.target
Now we have to break our dataset into sample target. To achieve this, we will create a classifier by importing the svm as we imported datasets from sklearn:
>>> from sklearn import svm
>>> classify = svm.SVC(gamma=0.001)
The main purpose of this is to slice or separate the images and labels. You can do this by using random module also. The SVC method of svm creates c support vector classification. See sklearn.svm.SVC for more information on this.
Get the first half of the images and target labels and store them in a variable:
#flatten sample images are stored in img variable
>>> img_half = img[:img_samples // 2]
#target labels are stored in labels variable
>>> labels_half = labels[:img_samples // 2]
Here img_samples is the total number of image samples.
Now that we have our images and target, we have to fit the model with the sample data as:
>>> classify.fit(img_half, labels_half)The result will be:
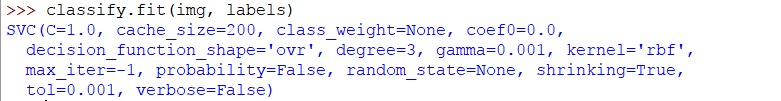
Basically what we did is we have declared that the 50% of the data (1st half) as the training model. So 1st 50% of the images will predict the next 50% of the images.
Now we will declare the remaining data as predict model or validation model.
>>> labels_expected = digits_data.target[img_samples // 2:]
>>> img_predicted = classify.predict(img[img_samples // 2:])
So we got the predicted images. Let’s plot them.
Recall the first step where we zipped the handwritten images and the target labels into a list. In this step we will zip together the images that we predicted and the 2nd half of the images that we reserved for validation.
>>> images_predictions = list(zip(digits_data.images[img_samples // 2:], img_predicted))Now simply use the for loop as in the first step to plot the images:
>>> for i, (image, predict) in enumerate(images_predictions[:10]):
#initialize the subplot of size 3x5
plt.subplot(3,5, i+1)
#turn of the axis values (the labels for each value in x and y axis)
plt.axis('off')
#display the predicted images in the subplot
plt.imshow(image, cmap=plt.cm.gray_r, interpolation='nearest')
#set the title for each subplot in the main plot
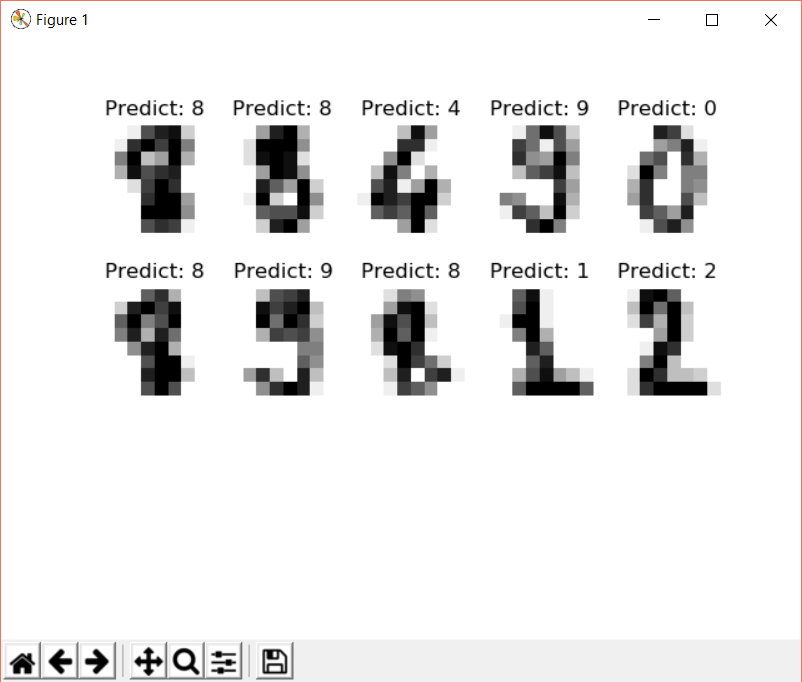
plt.title("Predict: %i" % predict)In the first step, we looped through the original images. It can be seen in the above snippet that we have iterated through the resultant or predicted images and also we are displaying the predicted labels and not the target labels.
Now display the plot as:
>>> plt.show()The result will be like the following:
If you want to check the accuracy of the predicted images, you can use the metrics from sklearn module.
>>> from sklearn import metricsIn the metrics module, we have a function called classification_report() which returns the report while comparing the expected labels result with the predicted resultant images.
Run the following print statement to print the report:
>>> print("Classification Report %s:\n%s\n"
      % (classify, metrics.classification_report(labels_expected, img_predicted)))
The result will be as follows:

Similarly, we can print the confusion matrix, which tells the accuracy of a certain classification.
>>> print("Confusion matrix:\n%s" % metrics.confusion_matrix(labels_expected, img_predicted))The result will be a matrix which tells that the matrix Ni, j equals the total number of observations present in i that should be present in j.
The result will be:


One Comment
Comments are closed.